Scioly.org:Maps
| Introduction to |
 |
| Using the Forums |
|---|
| Editing the Wiki |
| Events and Games |
| Site Features |
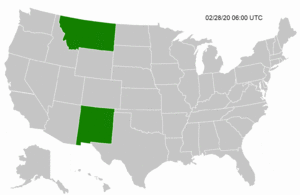
Maps may be used to show any location, region, state, etc. They are most often found in Infoboxes and can even have points plotted atop.
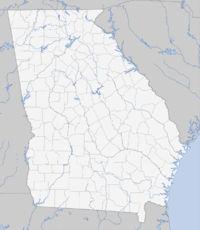
Similar maps can be found categorized together. SVG state maps can be found here whilst maps of regionals can be found here. More maps can be found by searching through uploaded files.
Map Usage
- To only include the map as an image, image syntax can be used:
[[file:filename.extension]]. Further parameters can be found under the wiki help page. - Maps can also be used in infoboxes. Parameters for implementing maps in infoboxes can be found in their respective documentation.
- Depending on the number of points, one of two templates is used to plot points.
- To plot one point, the Location map template should be used.
- To plot more than one point, the Location map many template should be used.
- To include a legend with the map, the legend template can be used.
Map Creation
File Formats
Reference: https://en.wikipedia.org/wiki/Wikipedia:WikiProject_Maps
JPEG files are discouraged as their lossy compression will result in blurry maps.
GIF allows for the creation of animated maps.
PNG is a lossless, truecolor image format. It is good for all maps but may be more difficult than an SVG image to edit.
SVG is vector graphics format and is most recommended because it has three main advantages:
- Images can be scaled without data loss, which allows large-sized and very high quality maps to be made;
- It is a text-based XML language and so can be edited and shared quickly and easily.
- It is a precisely-coded language which can be converted by script or CSS.
Uploading
Novel maps should be uploaded here for use.
SVG Map Creation
Visual Approach
Reference: https://scioly.org/wiki/index.php/User:Pepperonipi/Sandbox_5
To create SVG maps with an image editor:
- Download the SVG map from the Wikipedia page "Module:Location map/data/X" where X is the area you're looking for (such as Wikipedia:Module:Location map/data/Nevada)
- Open the SVG file in a program such as Inkscape or Adobe Illustrator
- Replace the following colors:
- fefee9→F4F4F4
- f6e1b9→cccccc
- c6ecff→C0D1E9
- 0978ab→2E66B6
- 646464→999999
- e0e0e0→999999
- Save the file as an SVG. The file should be less than 500 KB in order to be rendered on the wiki. If the normal file is over 500 KB, attempt to save the file as an optimized SVG.
- Upload the file to the wiki. Make sure to add Category:SVG Maps and corresponding subject area's categorization (e.g. Category:SVG State Maps).
Text Approach
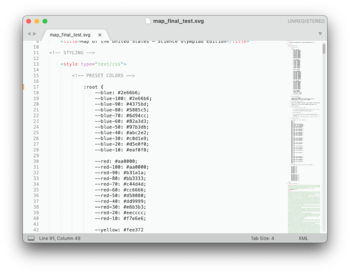
Maps can also be edited within a text editor (e.g. Notepad, Sublime Text, Atom). This approach allows adjusting appearances without an image editor, which may be preferred if you want to make quick changes or bulk edits (e.g. generating many maps from state data in a spreadsheet format).
To create or edit SVG maps with a text editor:
- Download the SVG map from File:Imagemap.svg.
- Rename the file to one that is descriptive, and if a file-naming convention exists, follows convention.
- Open the downloaded SVG file in a text editor such as Notepad, Sublime Text, or Atom.
- Scroll to line ~100 where you can custom style individual states or labels.
- Reference the color list starting at line 17 for preset colors you can use to stylize your map. Using these colors gives your map an appearance that is consistent with other maps across the Scioly.org Wiki.
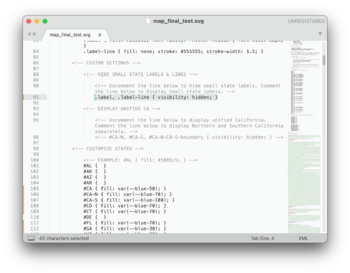
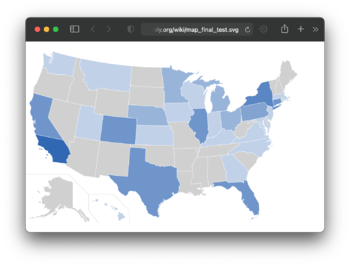
- You can uncomment line 91 to hide labels for small states (e.g. VT, NH).
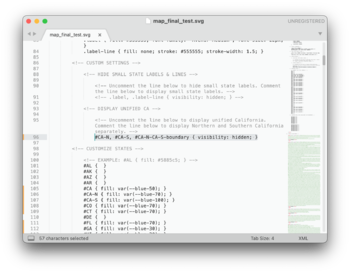
- You can uncomment line 96 to unify California; rather than displaying Northern and Southern California separately, this would display California as a single state.
- You can customize styles for states starting from line 98. To change the fill of a state, add
fill: #XXXXXX;between the two curly braces{and}, whereXXXXXXis the six-character hexadecimal color code. - You can customize labels for small states starting from line 155. Try to keep changes here to a minimum since colored text can be difficult to read.
- Preview your SVG by opening it in a web browser such as Chrome, Safari, or Firefox. You can make updates to the file in your text editor and refresh the page in your web browser to see the latest version.
- When you are finished, upload the file to the Wiki. Make sure to add Category:SVG Maps and corresponding subject area's categorization (e.g. Category:SVG State Maps).
| Hiding/Displaying Small State Labels |
|---|
|
| Uncomment line 91 to hide labels for small states (e.g. VT, NH). Leave this line commented to retain these labels. |
| Displaying California or Northern/Southern California |
|---|
 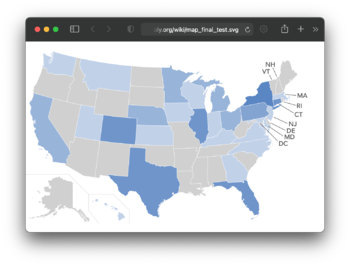
|
| Uncomment line 96 to display California as a single region. Leave this line commented to display Northern and Southern California separately. |
Conventions
Location maps
|
| |||||||||||||||||||||||||
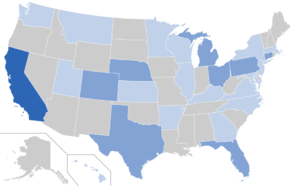
Gradient maps
|
| |||||||||||||||||||
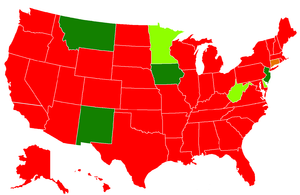
Area Maps
|
| |||||||||||||||||||||||||||||||||


