Number of Teams per State
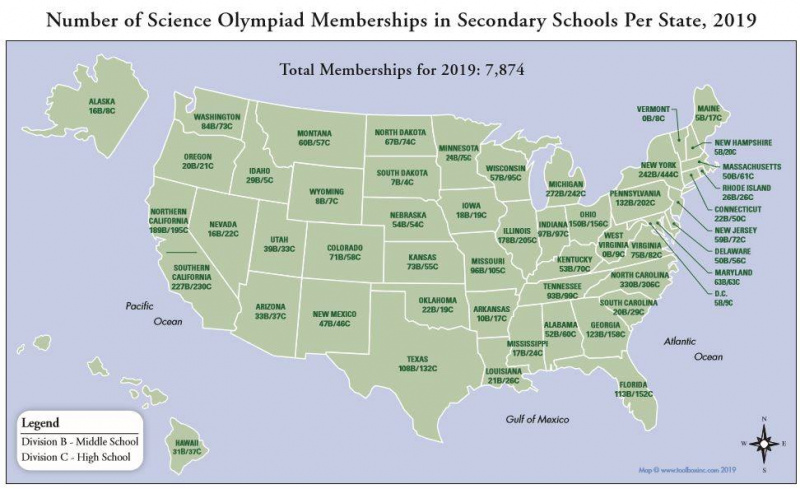
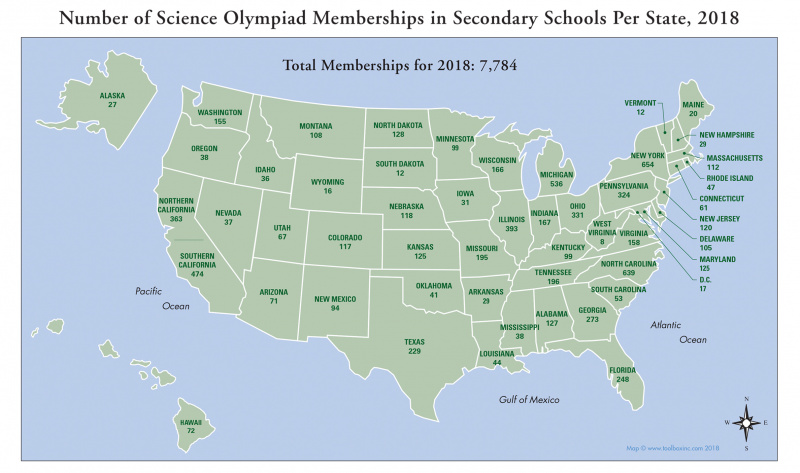
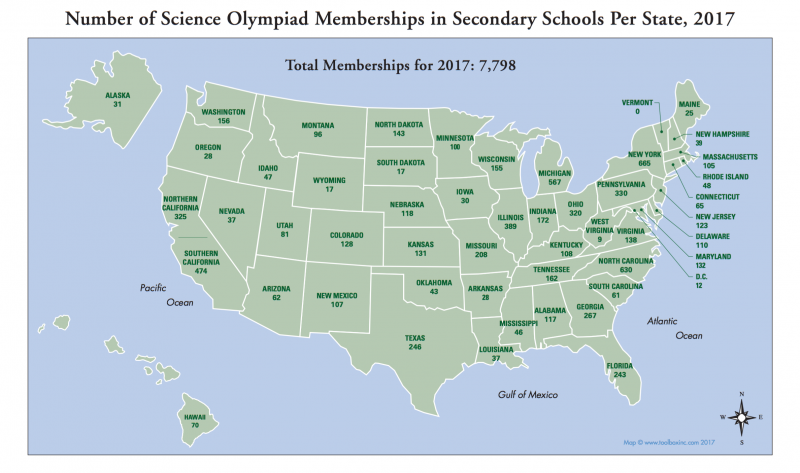
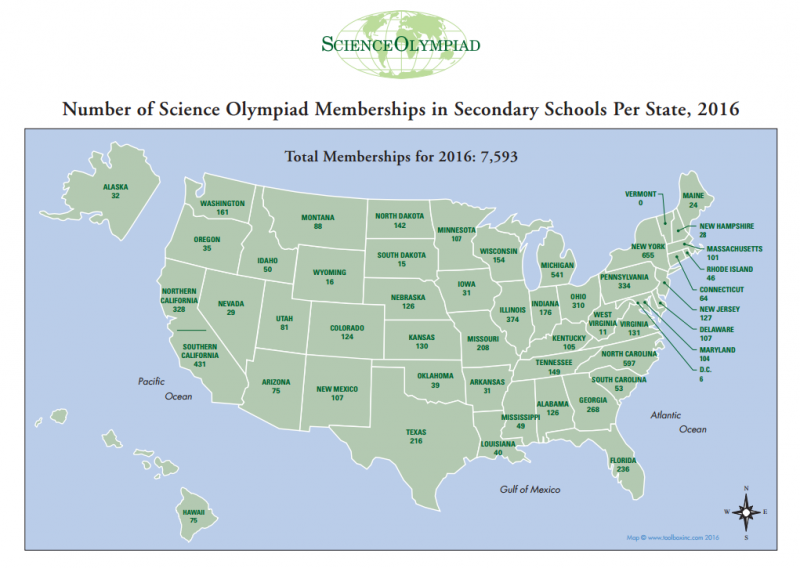
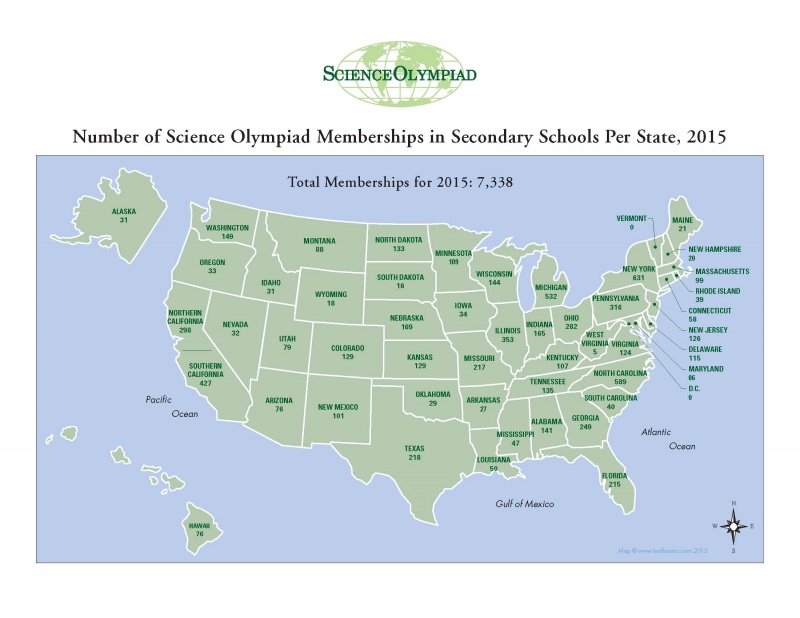
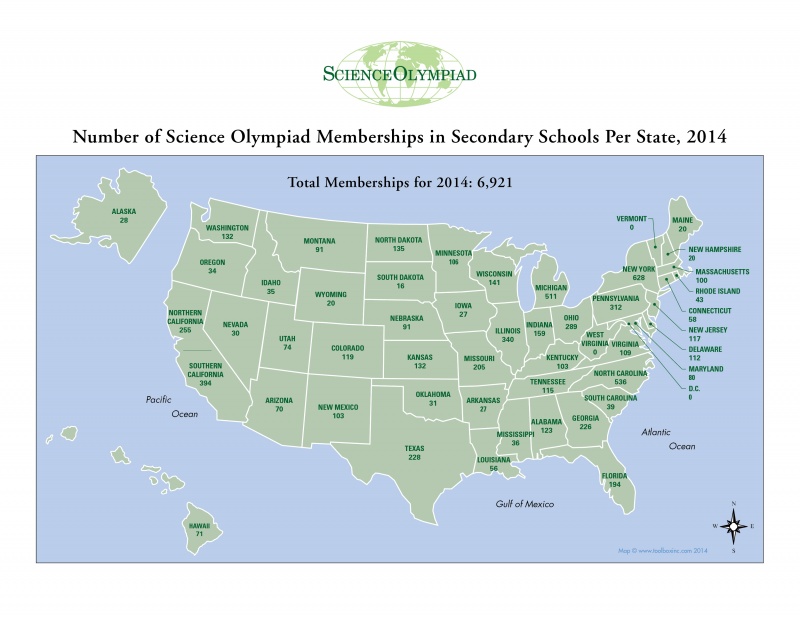
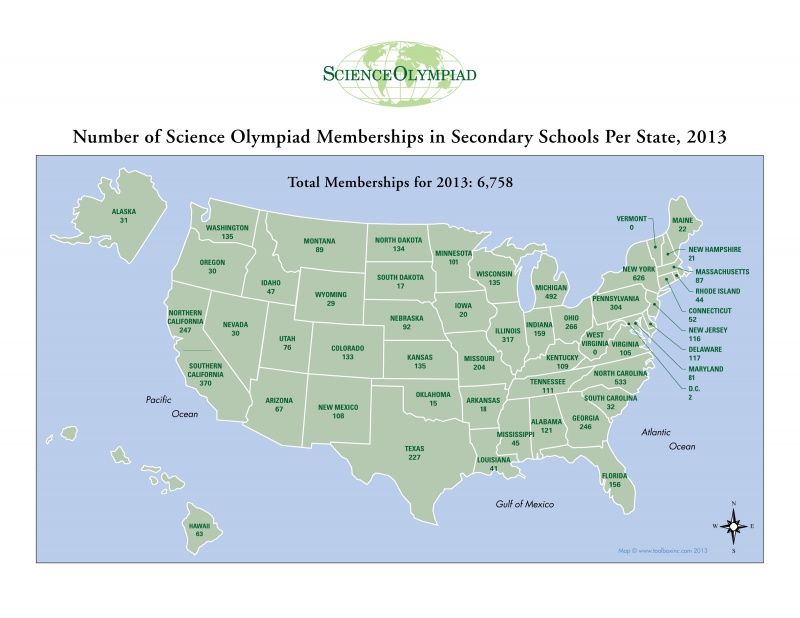
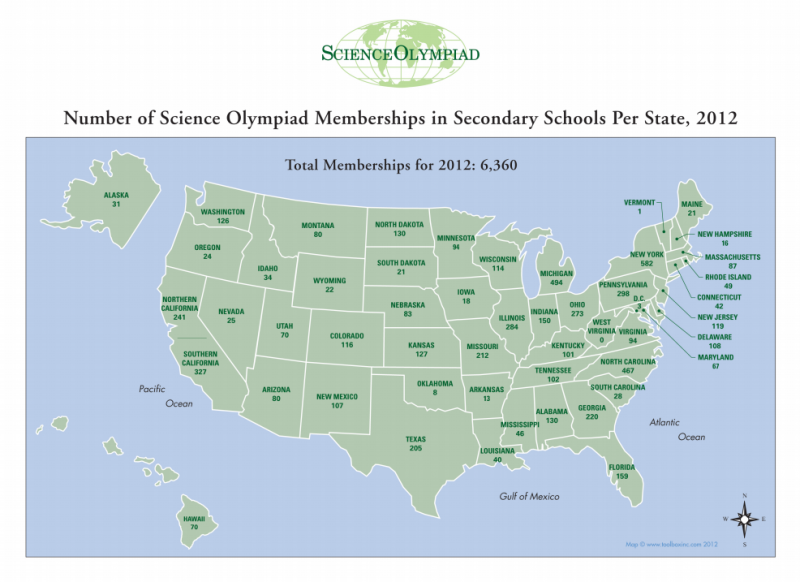
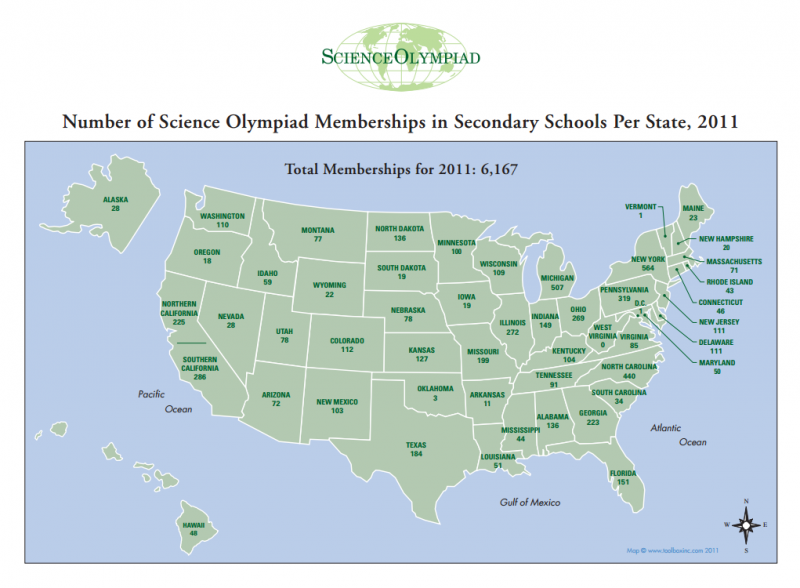
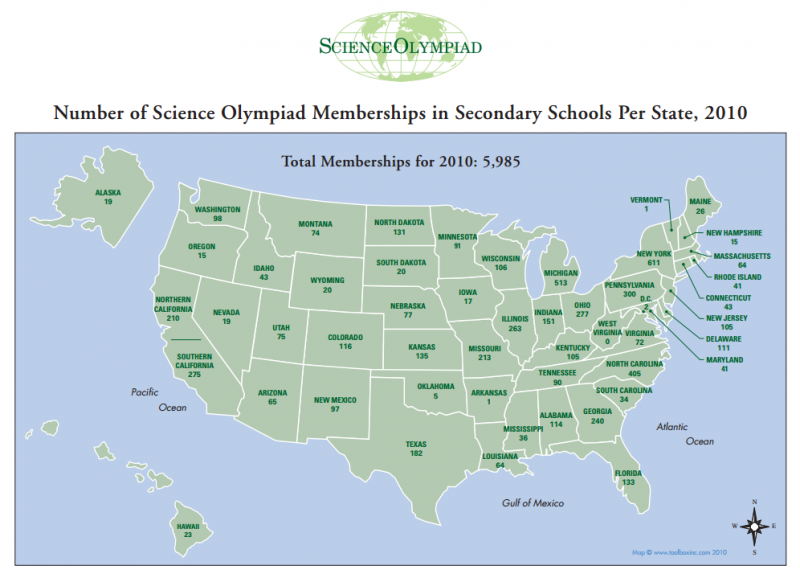
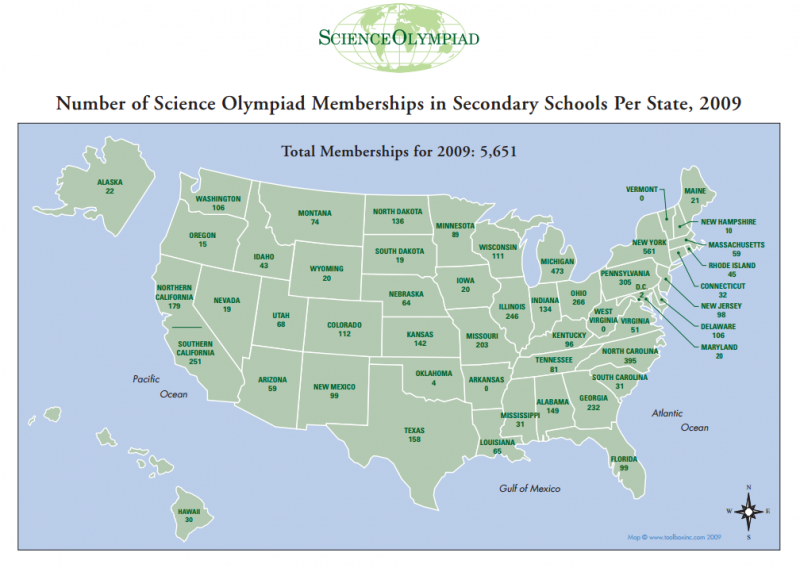
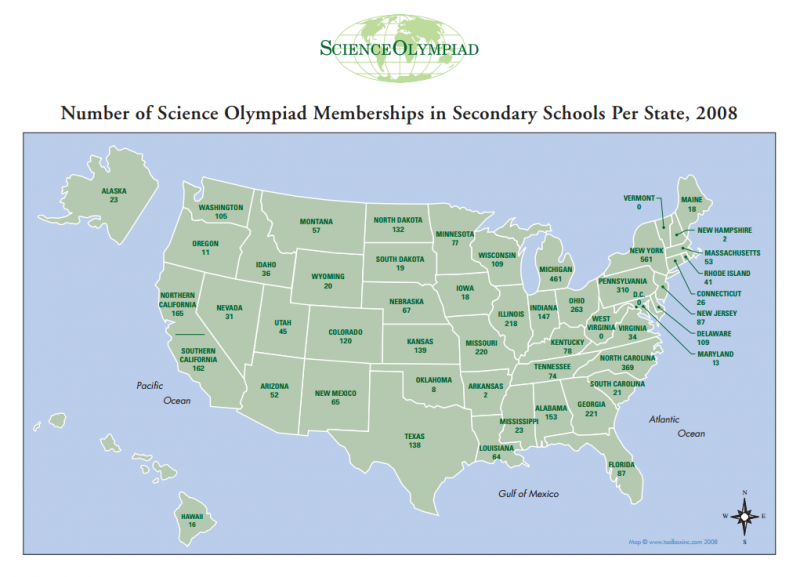
This is a list of states by the total number of teams registered in each. These statistics are based on the official figures published at soinc.org.
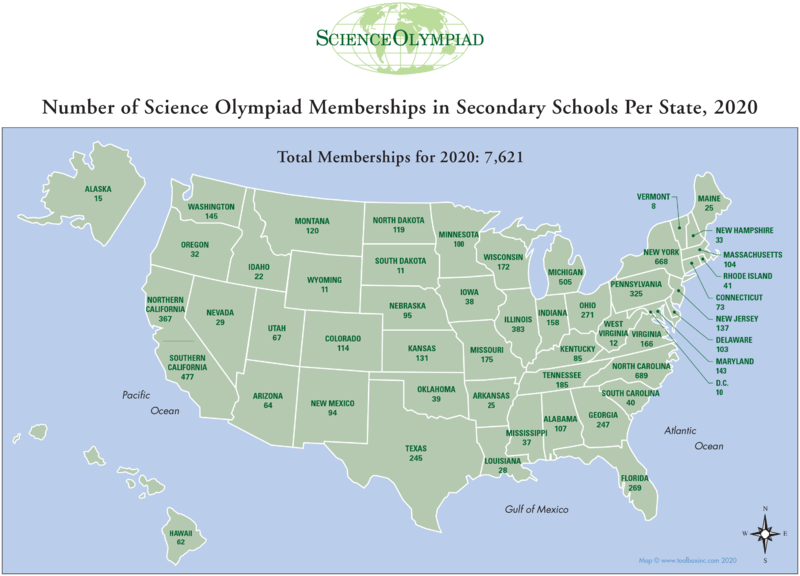
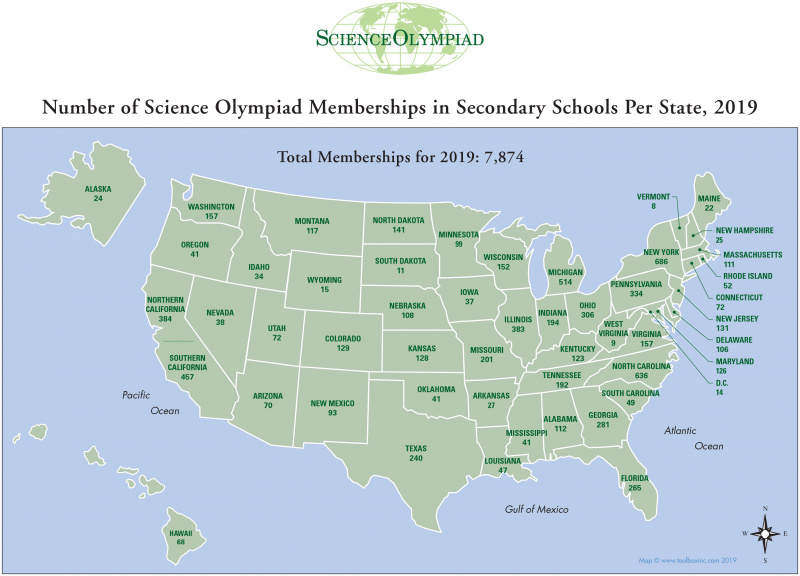
The difference column shows the percent increase or decrease from 2019 to 2020.
National Tournament Invitations
Each state organization automatically receives one national tournament invitation for each division. States with the highest registration numbers by division are then awarded a second national tournament invitation, up to a total of 60 teams per division. Currently, there are 51 Division C and 50 Division B state organizations. Thus, the 9 states with the most Division C teams will receive two Division C national tournament invitations, and the 10 states with the most Division B teams will receive two Division B national tournament invitations. In the event that a state organization declines its national tournament invitation for either division, the invitation passes to the state with the highest team registration in that division that has not already been awarded a second invitation for that division.
Number of Teams per State
States with an asterisk (*) sent two Division B teams to nationals in 2019, and states with a dagger (†) sent two Division C teams to nationals in 2019. States with superscript x (x) sent no Division B team to nationals in 2019, and states with superscript y (y) sent no Division C team to nationals in 2019. Note that the numbers shown in the table below represent combined Division B and C registrations, and therefore do not necessarily reflect the order in which states will be awarded two national tournament invitations.
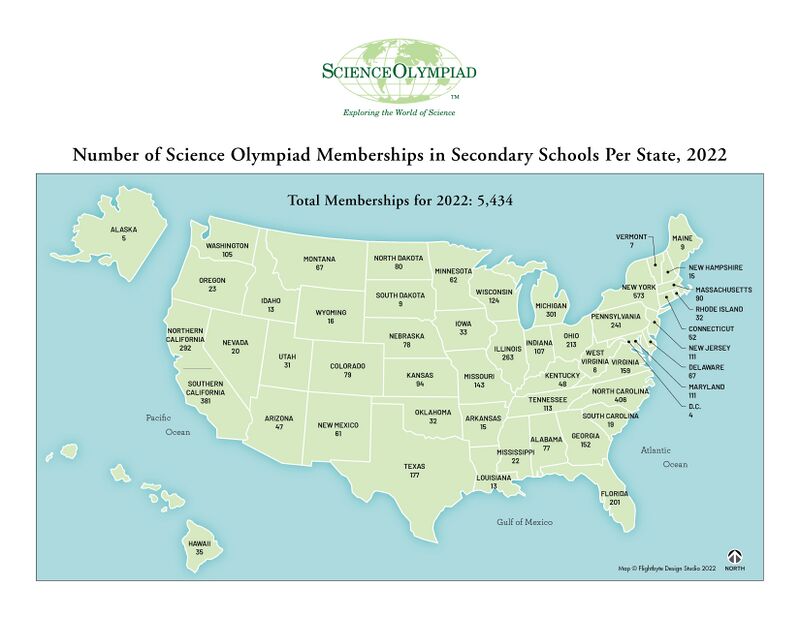
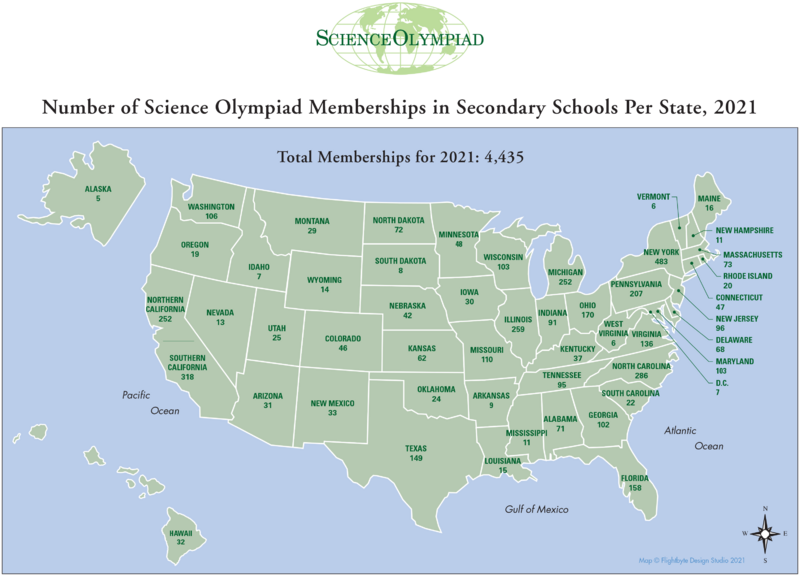
| State | Change from 2021 to 2022 | Change from 2020 to 2021 | Change from 2019 to 2020 | 2022 | 2021 | 2020 | 2019 | 2018 | 2017 | 2016 | 2015 | 2014 | 2013 | 2012 | 2011 | 2010 | 2009 | 2008 |
|---|---|---|---|---|---|---|---|---|---|---|---|---|---|---|---|---|---|---|
| Total | 5434 | 4435 | 7621 | 7874 | 7784 | 7798 | 7593 | 7338 | 6921 | 6758 | 6360 | 6167 | 5985 | 5651 | 5270 | |||
| Alabama | 77 | 71 | 107 | 112 | 127 | 117 | 126 | 141 | 123 | 121 | 130 | 136 | 114 | 149 | 153 | |||
| Alaska | 5 | 5 | 15 | 24 | 27 | 31 | 32 | 31 | 28 | 31 | 32 | 28 | 19 | 22 | 23 | |||
| Arizona | 47 | 31 | 64 | 70 | 71 | 62 | 75 | 76 | 70 | 67 | 80 | 72 | 65 | 59 | 52 | |||
| Arkansas | 15 | 9 | 25 | 27 | 29 | 28 | 31 | 27 | 27 | 18 | 13 | 11 | 1 | 0 | 2 | |||
| California (North) | 292 | 252 | 367 | 384 | 363 | 325 | 328 | 298 | 255 | 247 | 241 | 225 | 210 | 179 | 165 | |||
| California (South) | 381 | 318 | 477 | 457 | 474 | 474 | 431 | 427 | 394 | 370 | 327 | 286 | 275 | 251 | 162 | |||
| Colorado | 79 | 46 | 114 | 129 | 117 | 128 | 124 | 129 | 119 | 133 | 116 | 112 | 116 | 112 | 120 | |||
| Connecticut | 52 | 47 | 73 | 72 | 61 | 65 | 64 | 58 | 58 | 52 | 42 | 46 | 43 | 32 | 26 | |||
| Delaware | 67 | 68 | 103 | 106 | 105 | 110 | 107 | 115 | 112 | 117 | 108 | 111 | 111 | 106 | 109 | |||
| District of Columbia | 4 | 7 | 10 | 14 | 17 | 12 | 6 | 0 | 0 | 2 | 1 | 1 | 2 | 2 | 0 | |||
| Florida*† | 201 | 158 | 269 | 265 | 248 | 243 | 236 | 215 | 194 | 156 | 159 | 151 | 133 | 99 | 87 | |||
| Georgia*† | 152 | 102 | 247 | 281 | 273 | 267 | 268 | 249 | 226 | 246 | 220 | 223 | 240 | 232 | 221 | |||
| Hawaii | 35 | 32 | 62 | 68 | 72 | 70 | 75 | 76 | 71 | 63 | 70 | 48 | 23 | 30 | 16 | |||
| Idaho | 13 | 7 | 22 | 34 | 36 | 47 | 50 | 31 | 35 | 47 | 34 | 59 | 43 | 43 | 36 | |||
| Illinois*† | 263 | 259 | 383 | 383 | 393 | 389 | 374 | 353 | 340 | 317 | 284 | 272 | 263 | 246 | 218 | |||
| Indiana* | 107 | 91 | 158 | 194 | 167 | 172 | 176 | 165 | 159 | 159 | 150 | 149 | 151 | 134 | 147 | |||
| Iowa | 33 | 30 | 38 | 37 | 31 | 30 | 31 | 34 | 27 | 20 | 18 | 19 | 17 | 20 | 18 | |||
| Kansas | 94 | 62 | 131 | 128 | 125 | 131 | 130 | 129 | 132 | 135 | 127 | 127 | 135 | 142 | 139 | |||
| Kentucky | 43 | 37 | 85 | 123 | 99 | 108 | 105 | 107 | 103 | 109 | 101 | 104 | 105 | 96 | 78 | |||
| Louisiana | 13 | 15 | 28 | 47 | 44 | 37 | 40 | 50 | 56 | 41 | 40 | 51 | 64 | 65 | 64 | |||
| Maine | 9 | 16 | 25 | 22 | 20 | 25 | 24 | 21 | 20 | 22 | 21 | 23 | 26 | 21 | 18 | |||
| Maryland | 111 | 103 | 143 | 126 | 125 | 132 | 104 | 86 | 80 | 81 | 67 | 50 | 41 | 20 | 13 | |||
| Massachusetts | 90 | 73 | 104 | 111 | 112 | 105 | 101 | 99 | 100 | 87 | 75 | 71 | 64 | 59 | 53 | |||
| Michigan*† | 301 | 252 | 505 | 514 | 536 | 567 | 541 | 532 | 511 | 492 | 494 | 507 | 513 | 473 | 461 | |||
| Minnesota | 62 | 48 | 100 | 99 | 99 | 100 | 107 | 109 | 106 | 101 | 94 | 100 | 91 | 89 | 77 | |||
| Mississippi | 22 | 11 | 37 | 41 | 38 | 46 | 49 | 47 | 36 | 45 | 46 | 44 | 36 | 31 | 23 | |||
| Missouri | 143 | 110 | 175 | 201 | 195 | 208 | 208 | 217 | 205 | 204 | 212 | 199 | 213 | 203 | 220 | |||
| Montana | 67 | 29 | 120 | 117 | 108 | 96 | 88 | 88 | 91 | 89 | 80 | 77 | 74 | 74 | 57 | |||
| Nebraska | 78 | 42 | 95 | 108 | 118 | 118 | 126 | 169 | 91 | 92 | 83 | 78 | 77 | 64 | 67 | |||
| Nevada | 20 | 13 | 29 | 38 | 37 | 37 | 29 | 32 | 30 | 30 | 25 | 28 | 19 | 19 | 31 | |||
| New Hampshire | 15 | 11 | 33 | 25 | 29 | 39 | 28 | 20 | 20 | 21 | 16 | 20 | 15 | 10 | 2 | |||
| New Jersey | 111 | 96 | 137 | 131 | 120 | 123 | 127 | 126 | 117 | 116 | 119 | 111 | 105 | 98 | 87 | |||
| New Mexico | 61 | 33 | 94 | 93 | 94 | 107 | 107 | 101 | 103 | 108 | 107 | 103 | 97 | 99 | 65 | |||
| New York*† | 573 | 483 | 668 | 686 | 654 | 665 | 655 | 631 | 628 | 626 | 582 | 564 | 611 | 561 | 561 | |||
| North Carolina*† | 406 | 286 | 689 | 636 | 639 | 630 | 597 | 589 | 536 | 533 | 467 | 440 | 405 | 395 | 369 | |||
| North Dakota | 80 | 72 | 119 | 141 | 128 | 143 | 142 | 133 | 135 | 134 | 127 | 136 | 131 | 136 | 132 | |||
| Ohio*† | 213 | 170 | 271 | 306 | 331 | 320 | 310 | 282 | 289 | 266 | 273 | 269 | 277 | 266 | 263 | |||
| Oklahoma | 32 | 24 | 39 | 41 | 41 | 43 | 39 | 29 | 31 | 15 | 8 | 3 | 5 | 4 | 8 | |||
| Oregon | 23 | 19 | 32 | 41 | 38 | 28 | 35 | 33 | 34 | 30 | 24 | 18 | 15 | 15 | 11 | |||
| Pennsylvania*† | 241 | 207 | 325 | 334 | 324 | 330 | 334 | 316 | 312 | 304 | 298 | 319 | 300 | 305 | 310 | |||
| Rhode Island | 32 | 20 | 41 | 52 | 47 | 48 | 46 | 39 | 43 | 44 | 49 | 43 | 41 | 45 | 41 | |||
| South Carolina | 19 | 22 | 40 | 49 | 53 | 61 | 53 | 40 | 39 | 32 | 28 | 34 | 34 | 31 | 21 | |||
| South Dakota | 9 | 8 | 11 | 11 | 12 | 17 | 15 | 16 | 16 | 17 | 21 | 19 | 20 | 19 | 19 | |||
| Tennessee | 113 | 95 | 185 | 192 | 196 | 162 | 149 | 135 | 115 | 111 | 102 | 91 | 90 | 81 | 74 | |||
| Texas* | 177 | 149 | 245 | 240 | 229 | 246 | 216 | 218 | 228 | 227 | 210 | 184 | 182 | 158 | 138 | |||
| Utah | 31 | 25 | 67 | 72 | 67 | 81 | 81 | 79 | 74 | 76 | 70 | 78 | 75 | 68 | 45 | |||
| Vermontx | 7 | 6 | 8 | 8 | 12 | 0 | 0 | 0 | 0 | 0 | 0 | 1 | 1 | 0 | 0 | |||
| Virginia | 159 | 136 | 166 | 157 | 158 | 138 | 131 | 124 | 109 | 105 | 94 | 85 | 72 | 51 | 34 | |||
| Washington | 105 | 106 | 145 | 157 | 155 | 156 | 161 | 149 | 132 | 135 | 126 | 110 | 98 | 106 | 105 | |||
| West Virginiax | 6 | 6 | 12 | 9 | 8 | 9 | 11 | 5 | 0 | 0 | 0 | 0 | 0 | 0 | 0 | |||
| Wisconsin | 124 | 103 | 172 | 152 | 166 | 155 | 154 | 144 | 141 | 135 | 114 | 109 | 106 | 111 | 109 | |||
| Wyoming | 16 | 14 | 11 | 15 | 16 | 17 | 16 | 18 | 20 | 29 | 22 | 22 | 20 | 20 | 20 |
National Member Maps
Interactive Map
2022
Expand2022 State Membership Map
|
2021
Expand2021 State Membership Map
|
2020
Expand2020 State Membership Map
|
2019
Expand2019 State Membership Map
|
Expand2019 State Membership Map By Division
|
2018
Expand2018 State Membership Map
|
2017
Expand2017 State Membership Map
|
2016
Expand2016 State Membership Map
|
2015
Expand2015 State Membership Map
|
2014
Expand2014 State Membership Map
|
2013
Expand2013 State Membership Map
|
2012
Expand2012 State Membership Map
|
2011
Expand2011 State Membership Map
|
2010
Expand2010 State Membership Map
|
2009
Expand2009 State Membership Map
|
2008
Expand2008 State Membership Map
|
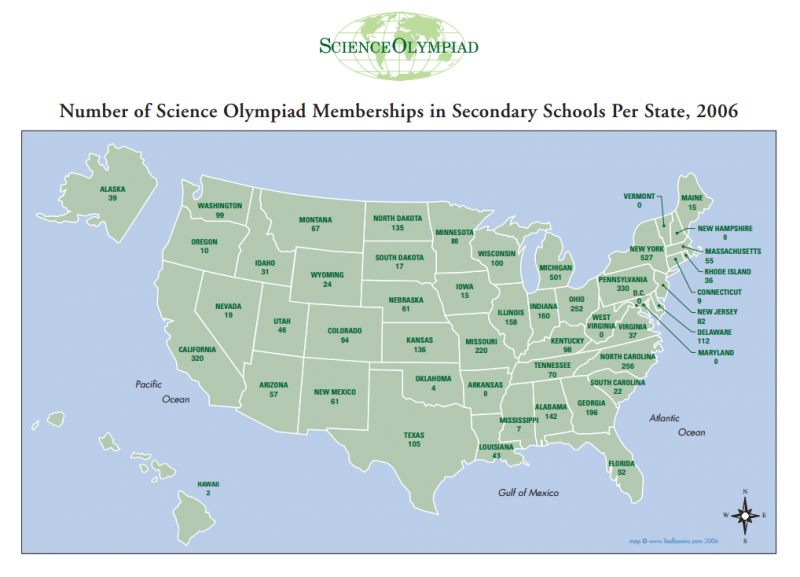
2006
Expand2006 State Membership Map
|
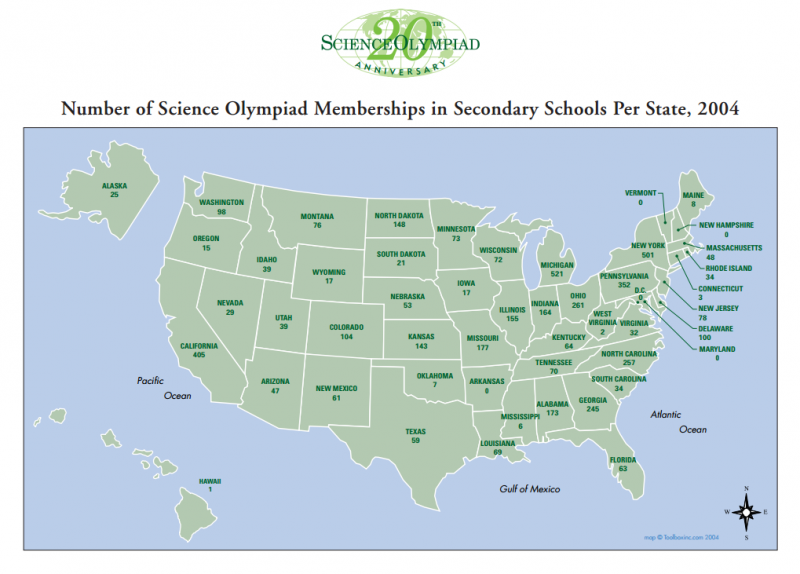
2004
Expand2004 State Membership Map
|


